Smith Chart provides a graphical representation of complex impedance and reflection coefficients, essential for RF circuit design and impedance matching, while Polar Plot offers a simpler visualization of magnitude and phase of a signal in a polar coordinate system. Explore the rest of the article to understand how these tools can optimize your analysis and design tasks effectively.
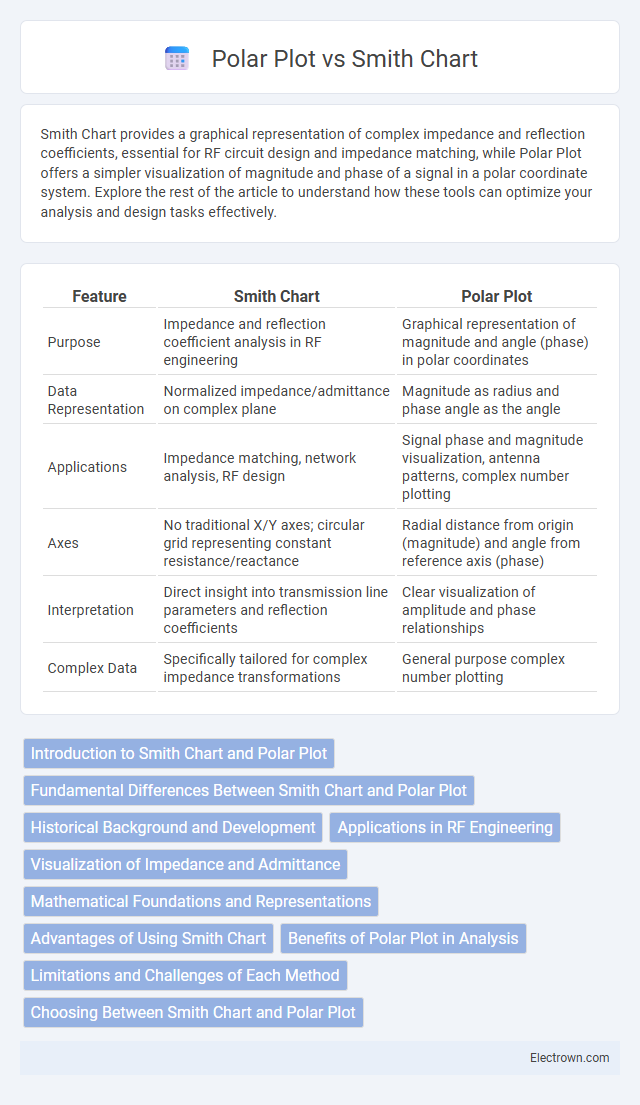
Table of Comparison
| Feature | Smith Chart | Polar Plot |
|---|---|---|
| Purpose | Impedance and reflection coefficient analysis in RF engineering | Graphical representation of magnitude and angle (phase) in polar coordinates |
| Data Representation | Normalized impedance/admittance on complex plane | Magnitude as radius and phase angle as the angle |
| Applications | Impedance matching, network analysis, RF design | Signal phase and magnitude visualization, antenna patterns, complex number plotting |
| Axes | No traditional X/Y axes; circular grid representing constant resistance/reactance | Radial distance from origin (magnitude) and angle from reference axis (phase) |
| Interpretation | Direct insight into transmission line parameters and reflection coefficients | Clear visualization of amplitude and phase relationships |
| Complex Data | Specifically tailored for complex impedance transformations | General purpose complex number plotting |
Introduction to Smith Chart and Polar Plot
The Smith Chart is a graphical tool used primarily in electrical engineering to represent complex impedance and reflection coefficients, facilitating the analysis and design of radio-frequency circuits. The Polar Plot, on the other hand, is a circular graph used to display data with a magnitude and direction, commonly utilized to visualize antenna radiation patterns and other angular-dependent functions. Both tools provide intuitive visualization methods for complex data, with the Smith Chart specialized for impedance matching and the Polar Plot tailored to directional measurements.
Fundamental Differences Between Smith Chart and Polar Plot
The Smith Chart is a specialized graphical tool used primarily in electrical engineering to represent complex impedance and reflection coefficients on a normalized plane, enabling impedance matching and network analysis. In contrast, a Polar Plot displays data points in terms of angle and magnitude, representing any angular data across disciplines without normalization or specific focus on impedance parameters. While the Smith Chart maps complex reflection coefficients with a unique circular grid to interpret transmission line behavior, the Polar Plot simply presents data in polar coordinates without the intricate contour lines essential for RF and microwave circuit design.
Historical Background and Development
The Smith Chart, developed by Phillip H. Smith in 1939, revolutionized microwave engineering by providing a graphical method to solve complex impedance matching problems. The Polar Plot, with origins tracing back to early trigonometric and radar applications, serves as a fundamental tool for representing magnitude and phase, especially in signal processing and control systems. Understanding the historical development of these tools helps you appreciate their specific roles in modern RF and communication engineering.
Applications in RF Engineering
Smith Chart is essential in RF engineering for impedance matching, enabling designers to visualize complex reflection coefficients and optimize transmission line parameters. Polar Plots are primarily used to represent magnitude and phase of signals, aiding in analyzing antenna radiation patterns and phase stability in RF circuits. Both tools complement each other in designing and troubleshooting RF components such as amplifiers, filters, and antennas by providing intuitive graphical representations of signal behaviors.
Visualization of Impedance and Admittance
The Smith Chart provides a comprehensive visualization of both impedance and admittance by mapping complex reflection coefficients onto a normalized complex plane, enabling easy interpretation of transmission line parameters. In contrast, the Polar Plot primarily displays the magnitude and phase of reflection coefficients without directly differentiating between impedance and admittance, making it less intuitive for circuit analysis. You can leverage the Smith Chart's dual representation to seamlessly analyze and match impedance and admittance in RF design projects.
Mathematical Foundations and Representations
The Smith Chart is based on complex impedance and reflection coefficient transformations, mapping normalized impedance onto a unit circle in the complex plane to simplify the analysis of transmission lines and matching networks. The Polar Plot represents magnitude and phase of complex quantities by plotting amplitude as radius and phase angle as the angular coordinate, providing a direct geometric interpretation of signal behavior. Your choice between these tools depends on whether you require impedance matching visualization (Smith Chart) or straightforward amplitude-phase data representation (Polar Plot).
Advantages of Using Smith Chart
The Smith Chart offers significant advantages in RF engineering by providing a visually intuitive method for analyzing complex impedance and reflection coefficients on a single graph. It simplifies the design process of matching networks and transmission lines by allowing direct reading of parameters like VSWR, impedance, and admittance without complex calculations. Your ability to quickly interpret and optimize RF circuits is enhanced, making the Smith Chart an essential tool compared to the more general Polar Plot.
Benefits of Polar Plot in Analysis
Polar plots provide intuitive visualization of complex impedance and reflection coefficients, enabling easier interpretation of phase and magnitude relationships in RF and microwave engineering. They allow for detailed frequency response analysis by representing data on a continuous circular scale, facilitating quick identification of resonant frequencies and impedance matching effectiveness. This method enhances accuracy in signal behavior assessment compared to the Smith Chart's more abstract representation.
Limitations and Challenges of Each Method
Smith Chart faces limitations in representing only normalized impedance and admittance, which can complicate analysis for non-standard parameters. Polar Plot struggles with ambiguity in phase representation, making it challenging to interpret complex reflection coefficients accurately. Your choice depends on whether you prioritize intuitive impedance matching (Smith Chart) or straightforward magnitude and phase visualization (Polar Plot).
Choosing Between Smith Chart and Polar Plot
Choosing between a Smith Chart and a Polar Plot depends on the specific application in RF engineering and impedance analysis. The Smith Chart provides a comprehensive representation of complex impedance and reflection coefficients, enabling intuitive impedance matching and network analysis. In contrast, the Polar Plot excels at visualizing phase and magnitude relationships, making it ideal for antenna pattern characterization and signal phase evaluation.
Smith Chart vs Polar Plot Infographic