Noise figure quantifies the degradation of the signal-to-noise ratio caused by components in a system, expressed in decibels (dB), while noise temperature represents this noise in terms of an equivalent physical temperature, measured in Kelvin (K). Understanding the relationship between noise figure and noise temperature is essential for optimizing your system's performance; read on to explore their differences and applications in detail.
Table of Comparison
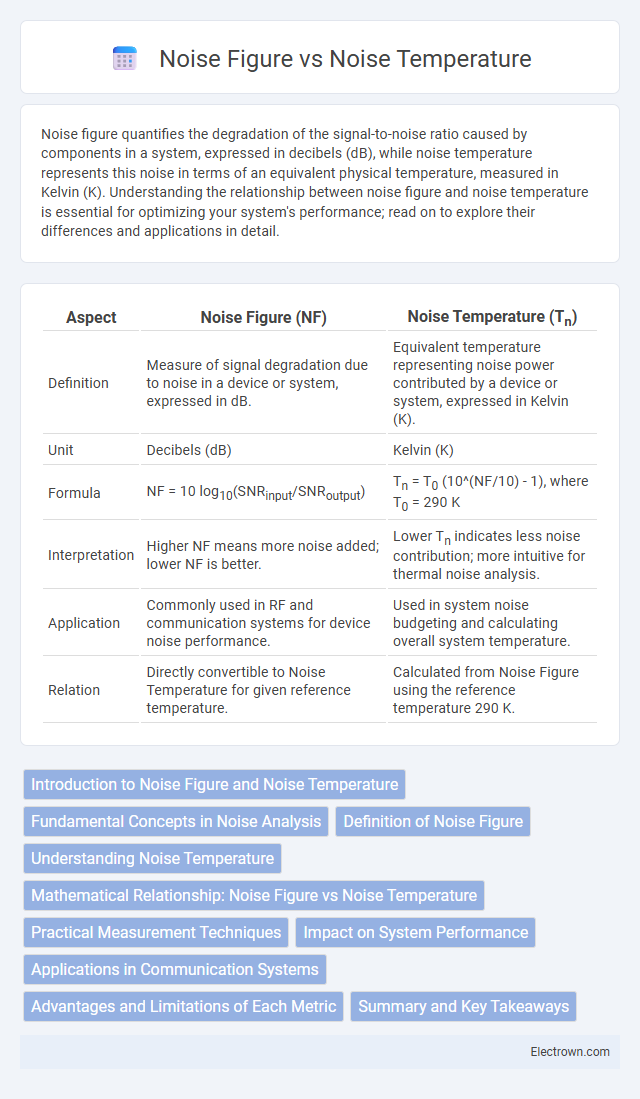
| Aspect | Noise Figure (NF) | Noise Temperature (Tn) |
|---|---|---|
| Definition | Measure of signal degradation due to noise in a device or system, expressed in dB. | Equivalent temperature representing noise power contributed by a device or system, expressed in Kelvin (K). |
| Unit | Decibels (dB) | Kelvin (K) |
| Formula | NF = 10 log10(SNRinput/SNRoutput) | Tn = T0 (10^(NF/10) - 1), where T0 = 290 K |
| Interpretation | Higher NF means more noise added; lower NF is better. | Lower Tn indicates less noise contribution; more intuitive for thermal noise analysis. |
| Application | Commonly used in RF and communication systems for device noise performance. | Used in system noise budgeting and calculating overall system temperature. |
| Relation | Directly convertible to Noise Temperature for given reference temperature. | Calculated from Noise Figure using the reference temperature 290 K. |
Introduction to Noise Figure and Noise Temperature
Noise Figure quantifies the degradation of the signal-to-noise ratio caused by components in a communication system, expressed in decibels (dB). Noise Temperature represents the equivalent temperature that produces the same noise power as the device, measured in kelvins (K), providing a physical context to noise performance. Understanding both metrics is crucial for optimizing Your receiver sensitivity and minimizing noise impact in RF design.
Fundamental Concepts in Noise Analysis
Noise Figure quantifies the degradation of the signal-to-noise ratio (SNR) in a system and is expressed in decibels (dB), representing how much noise an amplifier or device adds relative to an ideal noise-free component. Noise Temperature is a metric that translates noise power into an equivalent physical temperature measured in Kelvin, reflecting the thermal noise generated within a device or system. Both Noise Figure and Noise Temperature are fundamental parameters in noise analysis, facilitating the evaluation of equipment performance in radio frequency (RF) and communication systems by characterizing signal distortion caused by internal and external noise sources.
Definition of Noise Figure
Noise Figure (NF) quantifies the degradation of the signal-to-noise ratio caused by components in a communication system, expressed in decibels (dB). It measures how much noise an amplifier or device adds relative to an ideal noiseless amplifier, directly impacting the overall system performance and sensitivity. Understanding Noise Figure helps you evaluate the quality of RF components by comparing their noise contribution to a standardized baseline noise temperature, typically 290 K.
Understanding Noise Temperature
Noise temperature quantifies the amount of thermal noise generated by a device or component, expressed in Kelvin, representing the equivalent temperature of a resistor producing the same noise power. It provides a more intuitive measure than noise figure for systems involving cascading components, as noise temperatures can be directly added to calculate total system noise. Understanding noise temperature is crucial for designing low-noise amplifiers and receivers, where minimizing thermal noise improves signal quality and overall system sensitivity.
Mathematical Relationship: Noise Figure vs Noise Temperature
Noise Figure (NF) quantifies the degradation of the signal-to-noise ratio caused by a device, while Noise Temperature (Tn) represents the equivalent temperature that accounts for the device's noise contribution. The mathematical relationship between them is expressed as NF = 1 + (Tn / T0), where T0 is the standard reference temperature, typically 290 K. Understanding this relationship helps you accurately assess and optimize the noise performance of amplifiers and receivers in communication systems.
Practical Measurement Techniques
Noise figure measurement typically involves using a calibrated noise source and a spectrum analyzer or a noise figure analyzer to determine the degradation of the signal-to-noise ratio in RF components or systems. Noise temperature measurement relies on comparing the output noise power of the device under test at different physically controlled temperatures using techniques like the Y-factor method, which calculates the effective noise temperature from hot and cold source measurements. Accurate practical measurement demands careful impedance matching, precise calibration of noise sources, and consideration of environmental factors to minimize measurement uncertainty.
Impact on System Performance
Noise Figure and Noise Temperature significantly affect system performance by determining the amount of additional noise introduced by a receiver, influencing signal clarity and detection sensitivity. Lower Noise Figure and Noise Temperature values enhance system reliability, improving the signal-to-noise ratio (SNR) and enabling more accurate data communication and reception. Optimizing these parameters ensures your system maintains high performance in challenging electromagnetic environments.
Applications in Communication Systems
Noise Figure (NF) and Noise Temperature are critical parameters in communication systems used to evaluate receiver performance by quantifying noise contributions. Noise Figure represents the degradation of the signal-to-noise ratio (SNR) introduced by components, influencing the effective sensitivity of radio receivers and amplifiers. Noise Temperature, expressed in Kelvin, provides an absolute noise reference to model thermal noise sources, facilitating the design and optimization of low-noise amplifiers (LNAs) and overall system noise budgets in wireless and satellite communication links.
Advantages and Limitations of Each Metric
Noise Figure quantifies the degradation of signal-to-noise ratio caused by a device, making it advantageous for assessing system performance in communication circuits with ease and industry standardization; however, it is frequency-dependent and less intuitive for thermal noise understanding. Noise Temperature provides a direct measure of the effective temperature contributing to noise, offering intuitive insights in thermal noise analysis and aiding in the design of low-noise amplifiers, but it can be less straightforward for engineers used to signal ratio metrics and varies with system impedance. Your choice between Noise Figure and Noise Temperature should consider the application context, measurement convenience, and the desired interpretation of noise effects.
Summary and Key Takeaways
Noise figure quantifies the degradation of the signal-to-noise ratio caused by components in a system, measured in decibels (dB), while noise temperature expresses the equivalent temperature that would generate the same amount of noise power, measured in Kelvin (K). Both metrics are essential for assessing performance in RF and communication systems, with noise figure often preferred for design specifications and noise temperature used in thermal noise analysis. Understanding these parameters helps you optimize system sensitivity and minimize unwanted noise during signal processing.
Noise Figure vs Noise Temperature Infographic