The ECG vector represents the direction and magnitude of the heart's electrical activity at a specific moment, while the ECG axis reflects the overall average direction of this electrical activity throughout the cardiac cycle. Understanding how to interpret both can enhance your ability to assess cardiac health; read on to explore their differences and clinical significance.
Table of Comparison
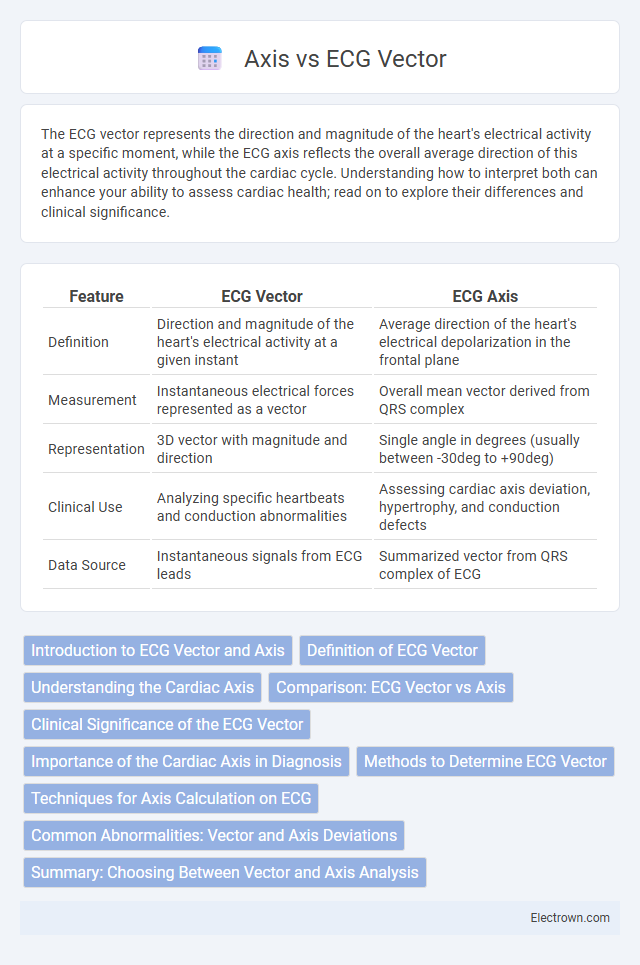
| Feature | ECG Vector | ECG Axis |
|---|---|---|
| Definition | Direction and magnitude of the heart's electrical activity at a given instant | Average direction of the heart's electrical depolarization in the frontal plane |
| Measurement | Instantaneous electrical forces represented as a vector | Overall mean vector derived from QRS complex |
| Representation | 3D vector with magnitude and direction | Single angle in degrees (usually between -30deg to +90deg) |
| Clinical Use | Analyzing specific heartbeats and conduction abnormalities | Assessing cardiac axis deviation, hypertrophy, and conduction defects |
| Data Source | Instantaneous signals from ECG leads | Summarized vector from QRS complex of ECG |
Introduction to ECG Vector and Axis
The ECG vector represents the direction and magnitude of the heart's electrical activity at any given moment, capturing the instantaneous flow of electrical impulses through cardiac tissue. The ECG axis, derived from the sum of these vectors, indicates the overall direction of the heart's electrical depolarization in the frontal plane, providing critical insights into cardiac orientation and function. Understanding your ECG vector and axis helps identify abnormalities such as axis deviation, which may signify underlying heart conditions.
Definition of ECG Vector
The ECG vector represents the magnitude and direction of the heart's electrical activity during each phase of the cardiac cycle, depicted as a dynamic arrow in a three-dimensional space. This vector quantifies the instantaneous electrical forces generated by myocardial depolarization and repolarization, providing detailed insights into cardiac conduction and rhythm. Understanding the ECG vector aids in interpreting complex arrhythmias and conduction abnormalities beyond the simplified axis angle measurement.
Understanding the Cardiac Axis
The cardiac axis represents the overall direction of the heart's electrical impulse during ventricular depolarization, typically measured in degrees on the frontal plane. ECG vectors illustrate the magnitude and direction of electrical activity at each instant, combining to form the resultant cardiac axis vector. Accurate interpretation of the cardiac axis helps identify normal heart orientation or detect abnormalities such as left or right axis deviation, which may indicate underlying cardiac conditions.
Comparison: ECG Vector vs Axis
The ECG vector represents the magnitude and direction of the heart's electrical activity at a specific moment, visualized as an arrow in a vectorcardiogram, while the ECG axis summarizes the average direction of ventricular depolarization in the frontal plane. The vector provides detailed instantaneous information for precise conduction analysis, whereas the axis offers a simplified, clinical overview useful for identifying deviations like left or right axis deviation. Understanding both enhances Your ability to interpret complex cardiac electrical patterns and diagnose conditions accurately.
Clinical Significance of the ECG Vector
The clinical significance of the ECG vector lies in its ability to represent the direction and magnitude of the heart's electrical activity, which helps in diagnosing arrhythmias, myocardial infarctions, and conduction abnormalities. By analyzing the vector's orientation, clinicians can determine the heart's electrical axis deviation, aiding in the detection of hypertrophy or chamber enlargement. Your accurate assessment of ECG vectors improves diagnostic accuracy and guides appropriate treatment decisions.
Importance of the Cardiac Axis in Diagnosis
The cardiac axis, derived from the ECG vector, provides critical information about the heart's electrical orientation and helps identify abnormalities such as axis deviation, hypertrophy, and conduction blocks. Accurate assessment of the cardiac axis guides clinicians in diagnosing conditions like left or right ventricular hypertrophy, myocardial infarction, and bundle branch blocks by revealing shifts in electrical conduction pathways. Understanding the cardiac axis enhances diagnostic precision and informs targeted treatment strategies for cardiovascular diseases.
Methods to Determine ECG Vector
ECG vector determination relies on methods such as the vectorcardiogram (VCG) and the hexaxial reference system, which analyze the magnitude and direction of electrical forces during cardiac depolarization. Lead combinations from standard 12-lead ECGs provide projection angles essential for calculating vector orientation, utilizing trigonometric relationships between limb leads. Advanced computational algorithms also enhance precision by integrating multidimensional data to define the instantaneous and mean electrical axis in the frontal and horizontal planes.
Techniques for Axis Calculation on ECG
Techniques for Axis Calculation on ECG involve analyzing the electrical heart vector by measuring the direction and magnitude of QRS complexes in limb leads, primarily leads I and aVF. The hexaxial reference system is commonly used to determine the mean electrical axis by plotting the net deflections and identifying the vector angle in degrees. Your accuracy in diagnosing axis deviations improves by applying these methods consistently, aiding in the detection of conditions like left or right axis deviation.
Common Abnormalities: Vector and Axis Deviations
ECG vector and axis deviations commonly indicate underlying cardiac abnormalities such as left or right axis deviation, which often reflect hypertrophy or conduction block in the ventricles. Left axis deviation is frequently associated with left ventricular hypertrophy or left anterior fascicular block, while right axis deviation may signify right ventricular hypertrophy or pulmonary hypertension. Understanding these deviations aids in diagnosing conditions like bundle branch blocks, myocardial infarction, and ventricular hypertrophy with precision in clinical cardiology.
Summary: Choosing Between Vector and Axis Analysis
ECG vector analysis provides detailed information on the magnitude and direction of the heart's electrical forces, enabling precise localization of cardiac events. Axis analysis simplifies this data into a single representative angle, offering quick insight into overall heart orientation and conduction abnormalities. Selecting between vector and axis analysis depends on the clinical need for either comprehensive electrical mapping or rapid assessment of cardiac axis deviations.
ECG Vector vs Axis Infographic