Receiver sensitivity measures the minimum signal level a receiver can detect, while noise figure quantifies the degradation of the signal-to-noise ratio caused by the receiver components. Understanding these parameters is crucial for optimizing your communication system's performance, so continue reading to explore their impact in detail.
Table of Comparison
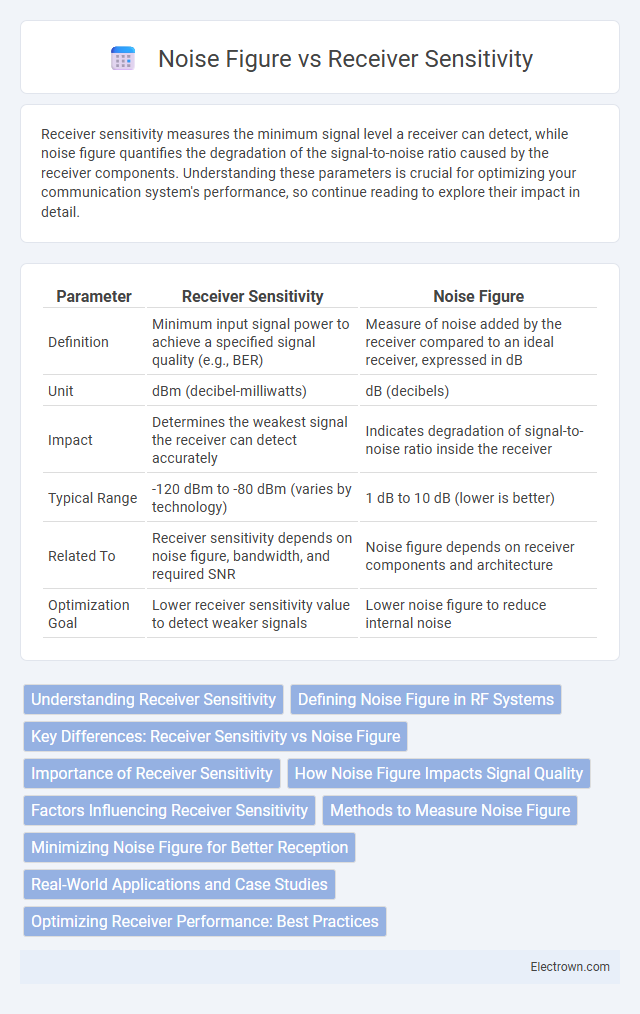
| Parameter | Receiver Sensitivity | Noise Figure |
|---|---|---|
| Definition | Minimum input signal power to achieve a specified signal quality (e.g., BER) | Measure of noise added by the receiver compared to an ideal receiver, expressed in dB |
| Unit | dBm (decibel-milliwatts) | dB (decibels) |
| Impact | Determines the weakest signal the receiver can detect accurately | Indicates degradation of signal-to-noise ratio inside the receiver |
| Typical Range | -120 dBm to -80 dBm (varies by technology) | 1 dB to 10 dB (lower is better) |
| Related To | Receiver sensitivity depends on noise figure, bandwidth, and required SNR | Noise figure depends on receiver components and architecture |
| Optimization Goal | Lower receiver sensitivity value to detect weaker signals | Lower noise figure to reduce internal noise |
Understanding Receiver Sensitivity
Receiver sensitivity defines the minimum signal power required for a receiver to detect a signal with acceptable quality, directly impacting the overall system performance. Noise figure measures the degradation of the signal-to-noise ratio caused by components in the receiver chain, influencing the effective sensitivity. Your ability to optimize receiver sensitivity depends on minimizing the noise figure to enhance signal detection in weak or noisy environments.
Defining Noise Figure in RF Systems
Noise figure in RF systems quantifies the degradation of the signal-to-noise ratio caused by components such as amplifiers or receivers, measured in decibels (dB). It represents the noise added by the system relative to an ideal noise-free device, directly impacting receiver sensitivity and overall system performance. Lower noise figure values indicate better receiver capability to detect weak signals in the presence of noise, enhancing communication reliability.
Key Differences: Receiver Sensitivity vs Noise Figure
Receiver sensitivity measures the minimum signal strength a receiver can detect and successfully process, directly impacting communication range and quality. Noise figure quantifies the degradation of the signal-to-noise ratio caused by the receiver's internal noise components, indicating overall receiver performance in noisy environments. While receiver sensitivity determines detection capability, noise figure reflects the receiver's ability to maintain signal integrity by minimizing added noise.
Importance of Receiver Sensitivity
Receiver sensitivity defines the minimum signal strength required for a receiver to detect and process signals effectively, directly impacting communication range and quality. A lower noise figure enhances receiver sensitivity by minimizing internal noise, improving the ability to distinguish weak signals from background interference. Optimizing receiver sensitivity ensures reliable performance in wireless systems, especially in low signal environments such as deep urban or remote areas.
How Noise Figure Impacts Signal Quality
Noise Figure (NF) directly affects Receiver Sensitivity by quantifying the amount of noise a receiver adds to the incoming signal, thereby influencing overall signal quality. A lower Noise Figure indicates better performance, as it means your receiver introduces less noise, enhancing the detection of weak signals. Optimizing Noise Figure improves signal-to-noise ratio (SNR), ensuring clearer communication and more reliable data reception.
Factors Influencing Receiver Sensitivity
Receiver sensitivity is primarily influenced by factors such as noise figure, bandwidth, and signal-to-noise ratio (SNR) requirements. The noise figure quantifies the degradation of the signal-to-noise ratio caused by components in the receiver, directly affecting the minimum detectable signal strength. Thermal noise from resistive components and interference from external sources also play significant roles in determining the achievable sensitivity of a receiver.
Methods to Measure Noise Figure
Methods to measure noise figure typically involve using a calibrated noise source and a spectrum analyzer to determine the signal-to-noise ratio (SNR) degradation introduced by the receiver. The Y-factor method, employing hot and cold noise sources, is a common technique that calculates noise figure based on the ratio of output noise power levels. Alternatively, the cold source method uses ambient temperature noise, providing a simpler but less precise measurement of receiver noise figure.
Minimizing Noise Figure for Better Reception
Minimizing noise figure is crucial for enhancing receiver sensitivity and overall signal quality in communication systems. A lower noise figure reduces the internal noise introduced by the receiver, allowing it to detect weaker signals more effectively. Optimizing your receiver's design by selecting low-noise components and improving impedance matching can significantly improve your system's reception performance.
Real-World Applications and Case Studies
Receiver sensitivity and noise figure are critical parameters influencing wireless communication performance in real-world applications such as cellular networks, satellite communication, and radar systems. Lower noise figures enhance receiver sensitivity, allowing Your devices to detect weaker signals in noisy environments, which is essential in long-range communications and urban areas with significant interference. Case studies in LTE and 5G networks demonstrate that optimizing these parameters leads to improved data throughput, extended coverage, and reduced power consumption.
Optimizing Receiver Performance: Best Practices
Optimizing receiver performance involves balancing receiver sensitivity and noise figure to achieve maximum signal clarity and range. Lower noise figure values enhance the receiver's ability to detect weak signals by minimizing internal noise contribution, directly improving sensitivity. Implementing high-quality filters, proper impedance matching, and low-noise amplifier designs ensures optimal receiver functionality with improved signal-to-noise ratio.
Receiver Sensitivity vs Noise Figure Infographic