Noise figure quantifies the degradation of the signal-to-noise ratio (SNR) caused by components in a communication system, indicating how much noise an amplifier or device adds relative to an ideal noiseless element. Understanding the relationship between noise figure and SNR is crucial for optimizing your system's performance; continue reading to explore how these metrics impact signal clarity and overall communication quality.
Table of Comparison
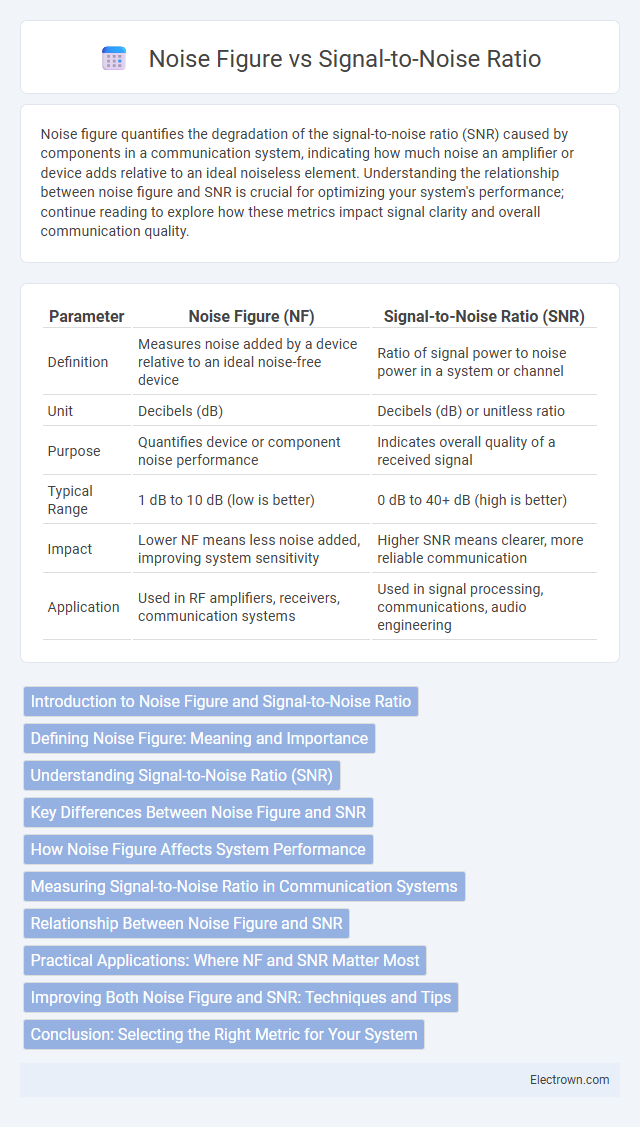
| Parameter | Noise Figure (NF) | Signal-to-Noise Ratio (SNR) |
|---|---|---|
| Definition | Measures noise added by a device relative to an ideal noise-free device | Ratio of signal power to noise power in a system or channel |
| Unit | Decibels (dB) | Decibels (dB) or unitless ratio |
| Purpose | Quantifies device or component noise performance | Indicates overall quality of a received signal |
| Typical Range | 1 dB to 10 dB (low is better) | 0 dB to 40+ dB (high is better) |
| Impact | Lower NF means less noise added, improving system sensitivity | Higher SNR means clearer, more reliable communication |
| Application | Used in RF amplifiers, receivers, communication systems | Used in signal processing, communications, audio engineering |
Introduction to Noise Figure and Signal-to-Noise Ratio
Noise figure quantifies the degradation of the signal-to-noise ratio (SNR) caused by components in a communication system, reflecting how much noise a device adds to the signal. Signal-to-noise ratio measures the strength of a desired signal relative to background noise, expressed in decibels (dB), crucial for assessing system performance and clarity. Understanding the relationship between noise figure and SNR helps you optimize your system design for improved signal quality and reduced noise interference.
Defining Noise Figure: Meaning and Importance
Noise figure quantifies the degradation of the signal-to-noise ratio (SNR) caused by components in a communication system, representing how much noise an amplifier or receiver adds to the original signal. A lower noise figure indicates better performance and higher sensitivity, essential for maintaining signal clarity and improving overall system reliability. Understanding noise figure aids in designing low-noise amplifiers and receivers, directly impacting the efficiency of wireless communication and radar systems.
Understanding Signal-to-Noise Ratio (SNR)
Signal-to-Noise Ratio (SNR) measures the strength of the desired signal relative to background noise, impacting the clarity and quality of communication systems. Noise figure quantifies the degradation of SNR caused by components within the signal chain, expressing the added noise in decibels (dB). Understanding SNR is crucial for optimizing your system's performance by minimizing noise figure to preserve signal integrity and maximize data transmission accuracy.
Key Differences Between Noise Figure and SNR
Noise figure (NF) quantifies the degradation of the signal-to-noise ratio (SNR) caused by components in a communication system, expressed in decibels (dB), while SNR measures the actual ratio of signal power to noise power at a specific point. NF is a device-specific parameter indicating noise performance, whereas SNR is a system-level measurement reflecting overall signal quality. Understanding these key differences helps you optimize your system's design to minimize noise and improve signal clarity.
How Noise Figure Affects System Performance
Noise figure (NF) quantifies the degradation of the signal-to-noise ratio (SNR) caused by components within a communication system, directly impacting system performance. A lower noise figure indicates less added noise, preserving SNR and enhancing signal clarity, sensitivity, and overall data quality. Your system's reliability and effective range improve significantly when noise figure is minimized, ensuring better detection of weak signals in noisy environments.
Measuring Signal-to-Noise Ratio in Communication Systems
Measuring signal-to-noise ratio (SNR) in communication systems involves comparing the power of the desired signal to the power of background noise, usually expressed in decibels (dB). Noise figure quantifies the degradation of SNR caused by components within the signal chain, indicating how much noise a device adds to the signal. Understanding the relationship between noise figure and SNR helps you optimize receiver performance and ensure reliable signal quality in your communication system.
Relationship Between Noise Figure and SNR
Noise figure (NF) quantifies the degradation of the signal-to-noise ratio (SNR) as a signal passes through a system, representing the noise added by the device relative to an ideal noiseless amplifier. A lower noise figure indicates less added noise, preserving a higher output SNR and improving overall system performance. The relationship shows that SNR output equals the input SNR divided by the noise figure expressed as a linear ratio, demonstrating how NF directly impacts the quality of received signals.
Practical Applications: Where NF and SNR Matter Most
Noise figure (NF) directly impacts the quality and performance of RF and communication systems by quantifying the degradation of signal-to-noise ratio (SNR) through receiver components. Practical applications where NF and SNR matter most include wireless communication, satellite receivers, and radar systems, where maintaining high SNR is critical for signal clarity and data integrity. Understanding and optimizing NF in your system helps preserve SNR, ensuring reliable and efficient signal detection in challenging noise environments.
Improving Both Noise Figure and SNR: Techniques and Tips
Improving noise figure and signal-to-noise ratio (SNR) involves using low-noise amplifiers (LNAs) and optimizing impedance matching to minimize signal loss and distortion. Implementing high-quality filtering reduces unwanted noise, while proper shielding and grounding techniques prevent electromagnetic interference (EMI). Employing digital signal processing (DSP) algorithms further enhances SNR by effectively distinguishing signal from noise in communication systems.
Conclusion: Selecting the Right Metric for Your System
Noise figure quantifies the degradation of the signal-to-noise ratio caused by a device, making it a critical metric for evaluating the noise performance of amplifiers and receivers. Signal-to-noise ratio (SNR) measures the overall quality of a signal relative to background noise in the entire system. You should choose noise figure when focusing on component-level noise contributions and SNR when assessing the end-to-end signal quality in your communication system.
noise figure vs signal-to-noise ratio Infographic